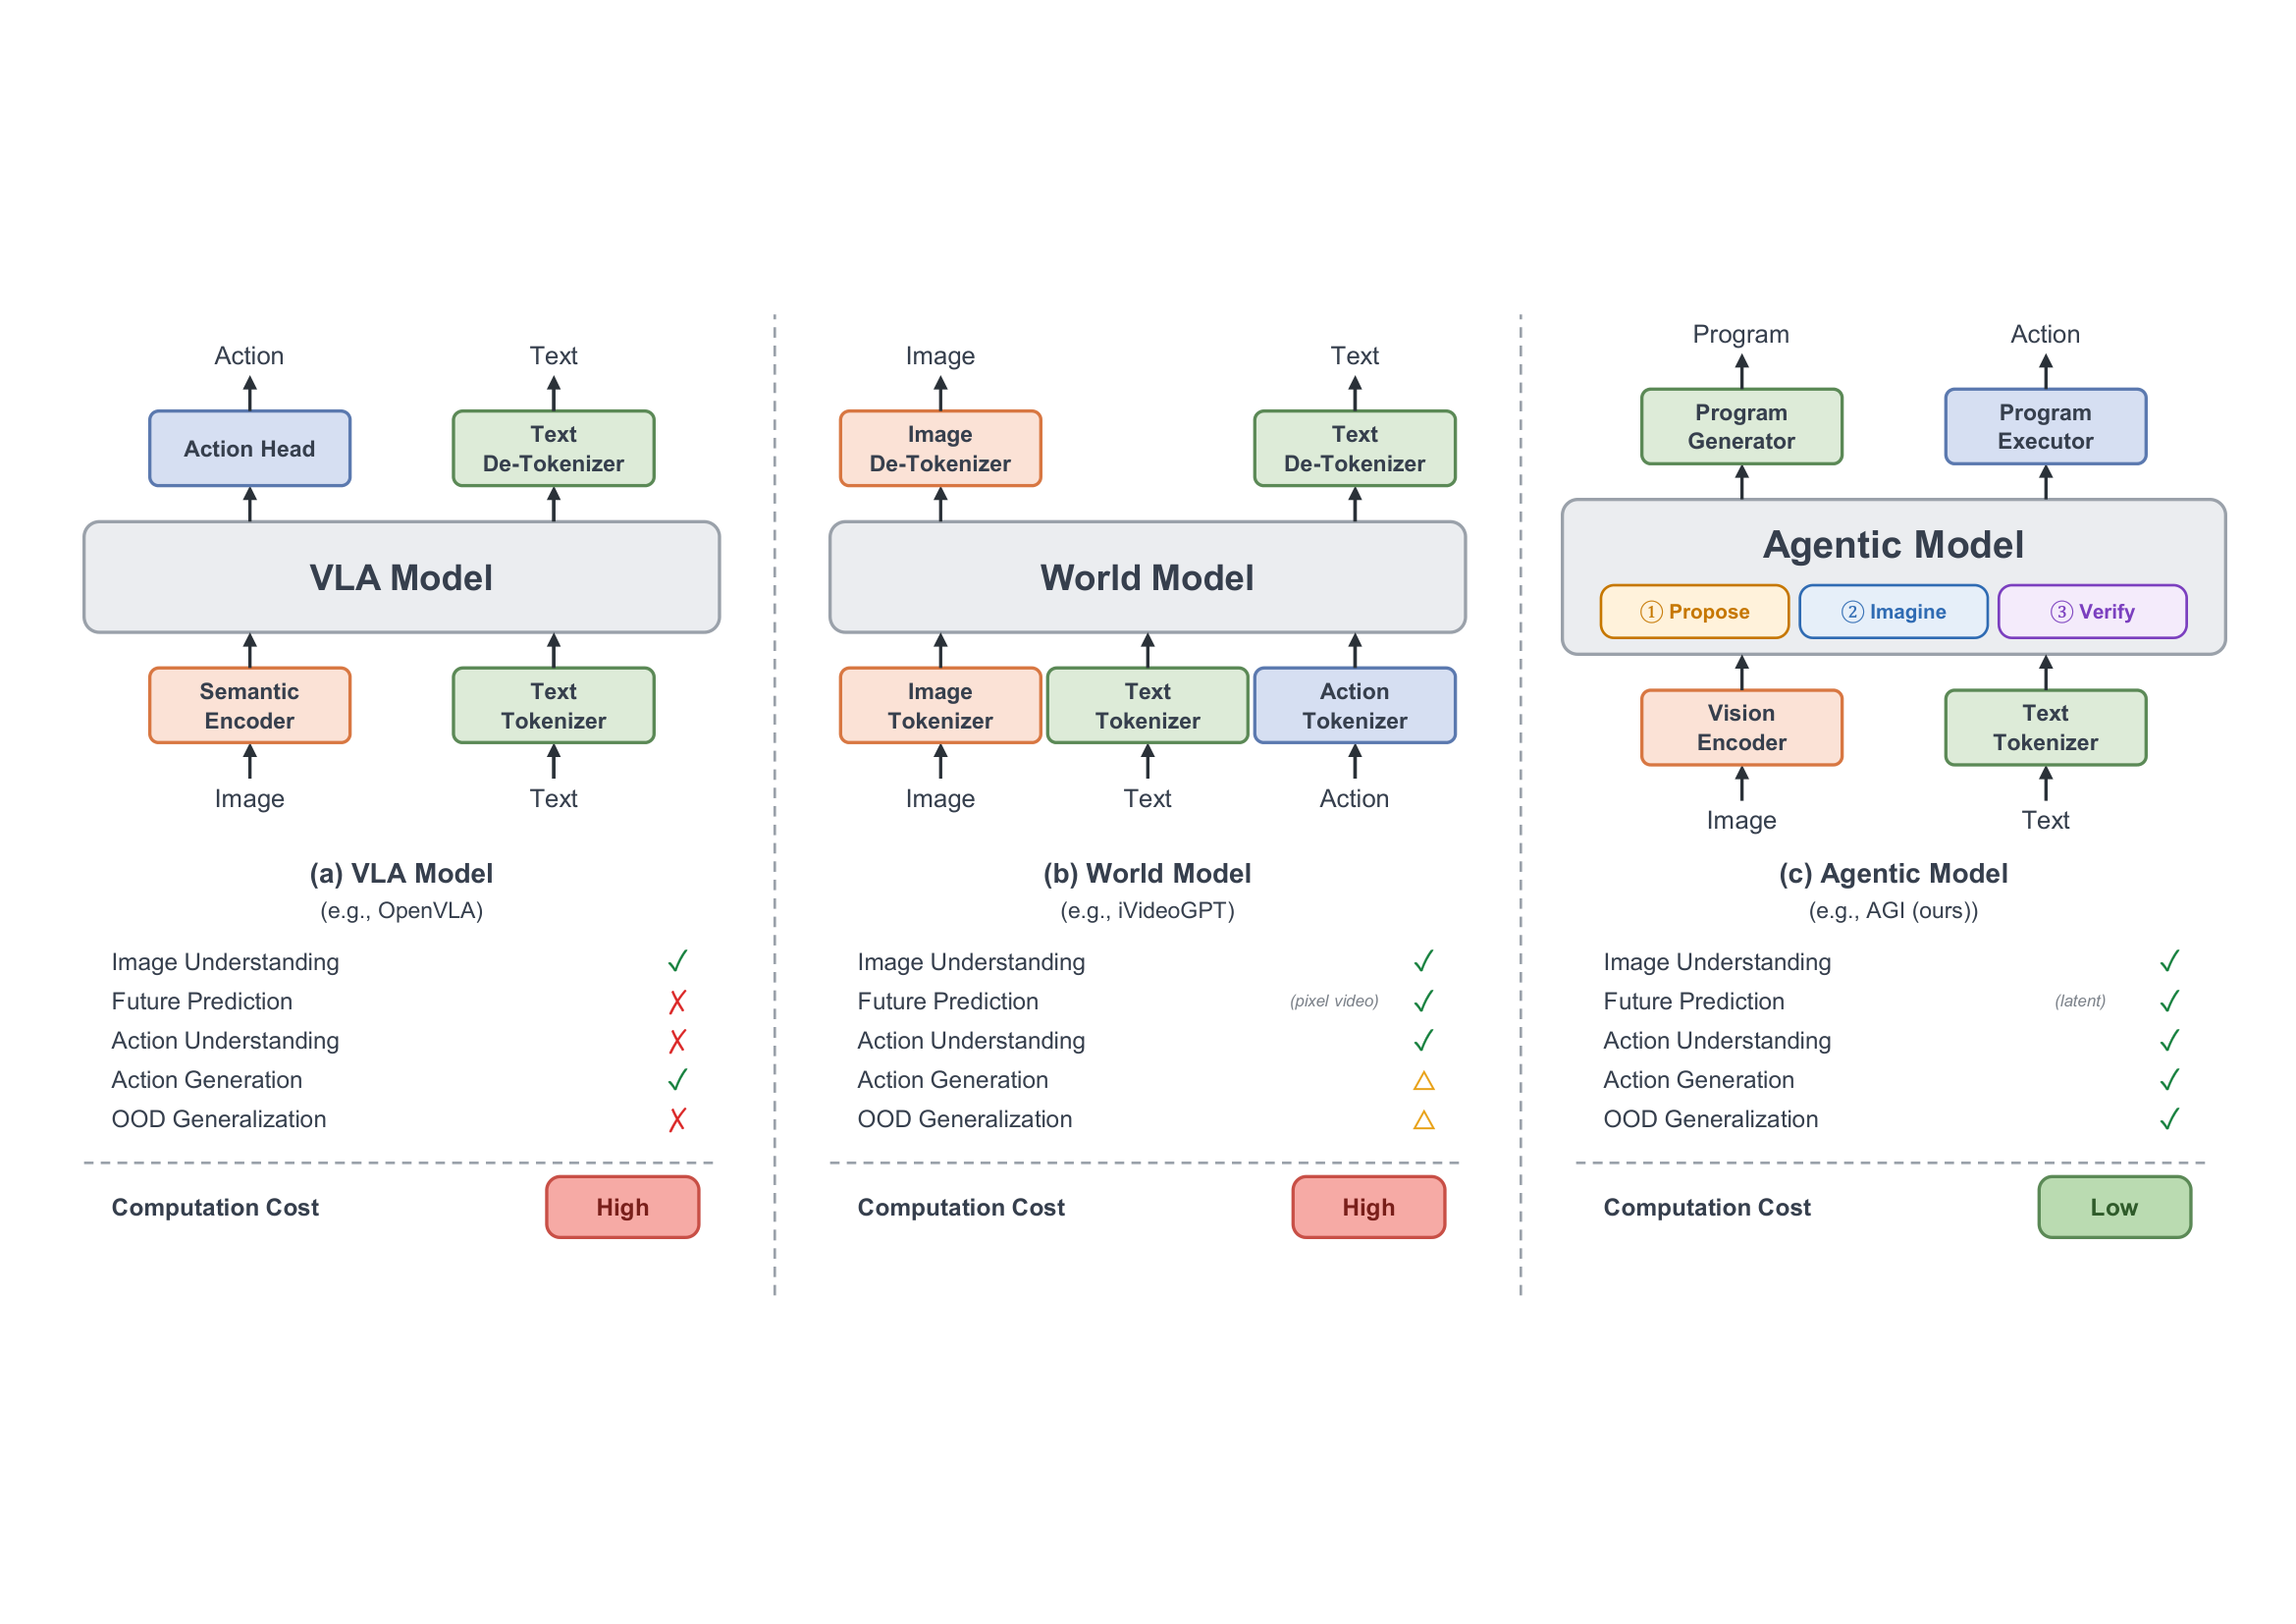
AGI: Agentic Intelligence and Latent Lookahead for Robust Manipulation
Author names, affiliations and code links are withheld while the paper is under anonymous review.
Real-World Robot Experiments
We evaluate AGI on four real-world tabletop manipulation tasks using a 6-DoF AgileX Piper (WEGO) manipulator arm equipped with a parallel-jaw gripper, with local inference running on a single NVIDIA RTX 3080 GPU. Visual feedback is provided by a wrist-mounted camera and a static third-person camera overlooking the tabletop workspace. Across 80 consecutive rollouts (20 trials per task), AGI achieves an overall success rate of 83.8% (67/80).
Task 1: Red Cube Pick-and-Place
70.0% (14/20)Task 2: White Cube Pick-and-Place
80.0% (16/20)Task 3: Pink Cube to Green Tray
90.0% (18/20)Task 4: Sequential Two-Cube Placement
95.0% (19/20)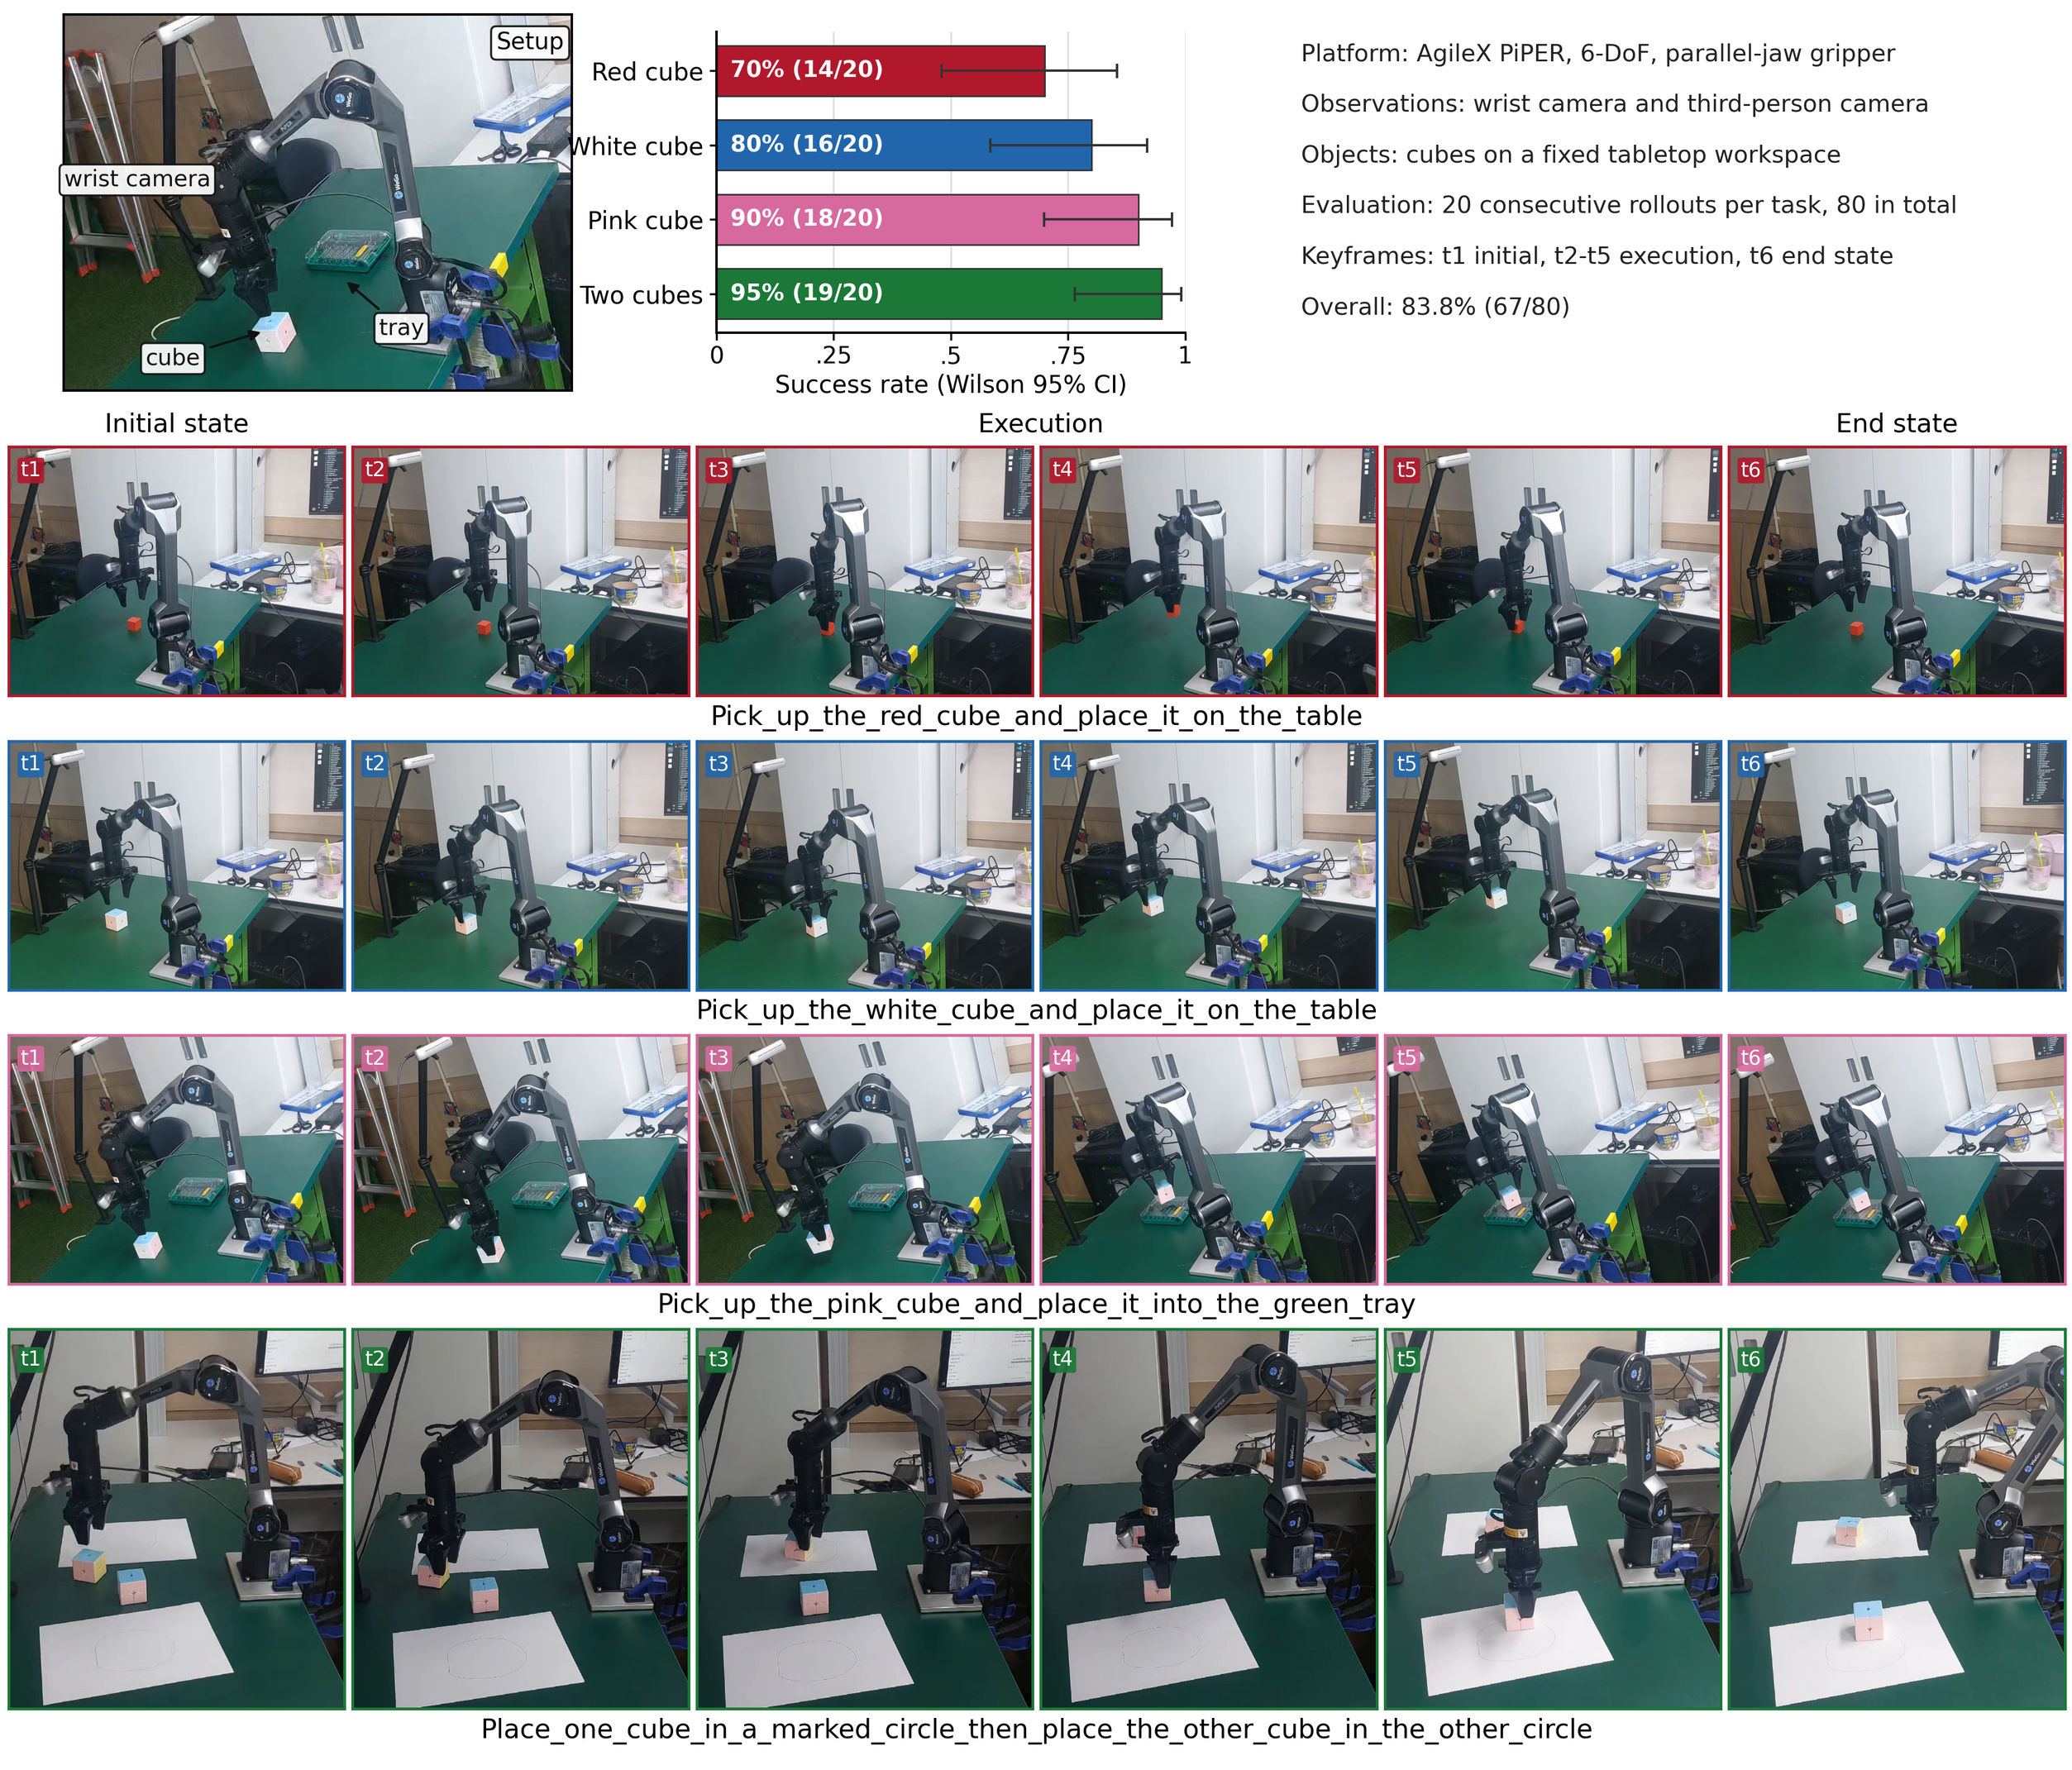
LIBERO-PRO
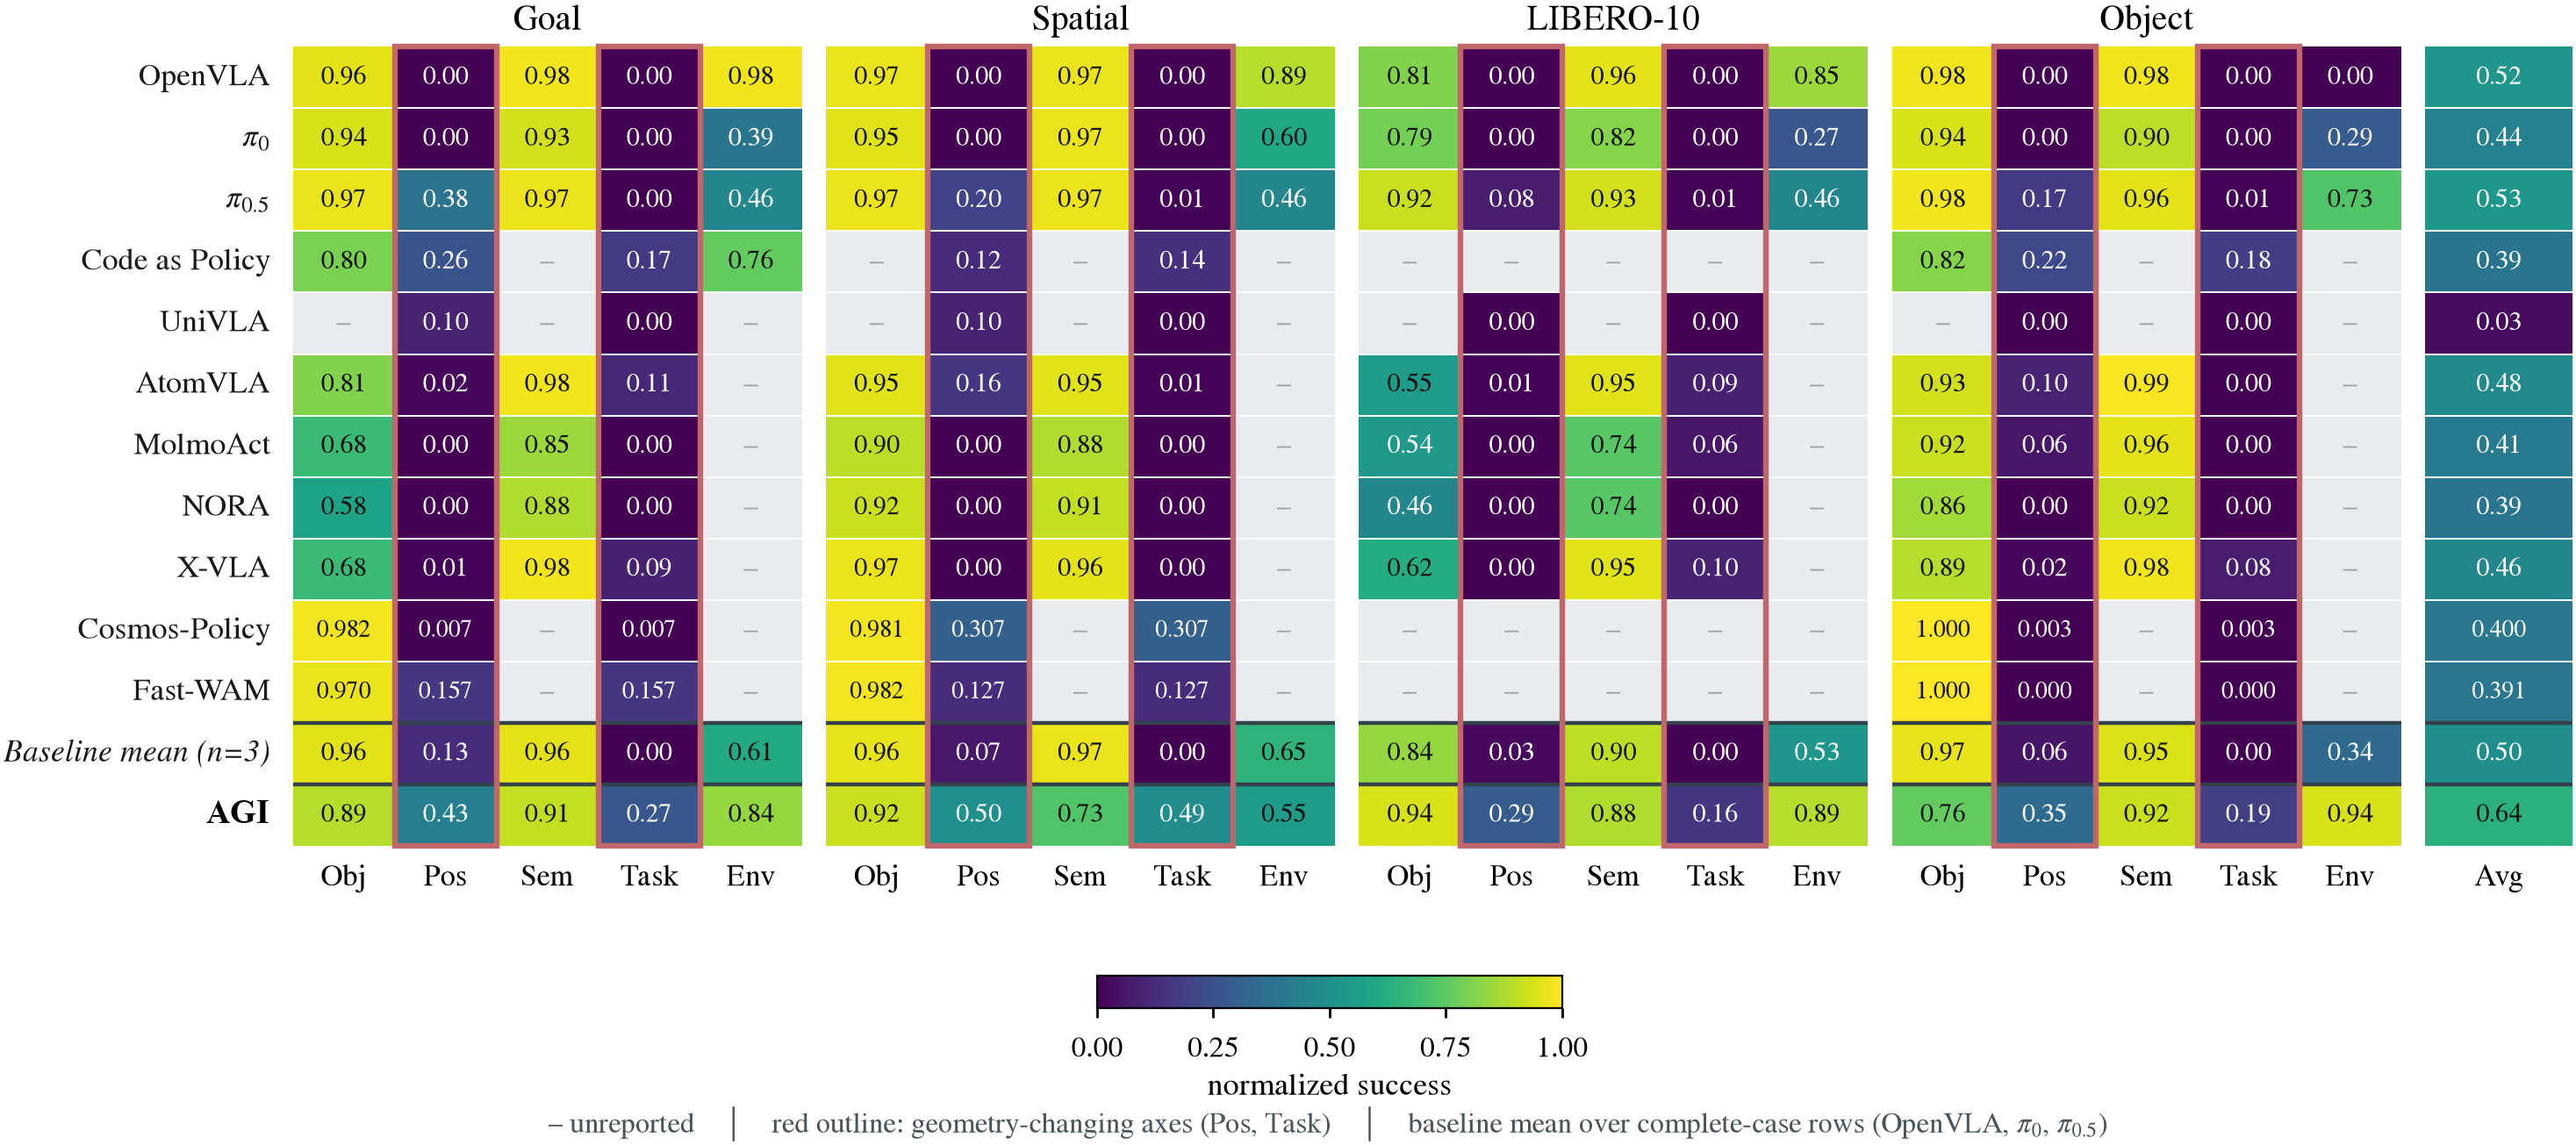
Normalized success under five perturbation axes. Pick a suite; click a column header to sort. Cell shading tracks the value, so the Position and Task columns read at a glance.
| Model | Obj | Pos | Sem | Task | Env | Avg. SR |
|---|
Dashes mark cells the source did not report, and are never imputed. On the Spatial suite, OpenVLA and π0 score 0.00 on both Position and Task, while our loop reaches 0.50 and 0.49. The gain is a redistribution rather than uniform dominance: Spatial-Semantic success is 0.73 against 0.88–0.97 for the displayed baselines, and the Object-suite Object score is 0.76 against leaders at 0.98.
Meta-World and LIBERO-X
Hover a bar to read its exact value.
Meta-World success rate (%) across difficulty splits, 20 episodes per task over 50 tasks. The three strongest displayed baselines are shown; the full table is below. Protocol differences make this panel contextual rather than a controlled cross-paper ranking.
| Method | Venue | Params | Easy | Mid | Hard | V. Hard | Avg. |
|---|---|---|---|---|---|---|---|
| HarmonyDream | ICML'24 | 77M | 81.0 | 91.0 | 72.5 | 44.5 | 72.3 |
| DP | IJRR'25 | 80M | 83.6 | 31.1 | 9.0 | 26.6 | 37.6 |
| TinyVLA | ICRA'25 | 1.5B | 77.6 | 21.5 | 11.4 | 15.8 | 31.6 |
| Mamba Policy | IROS'25 | – | 95.4 | 92.2 | 48.3 | 71.2 | 76.8 |
| π0 | RSS'25 | 3.3B | 71.8 | 48.2 | 41.7 | 30.0 | 47.9 |
| AGI Ours | – | 277M | 98.3 | 95.7 | 91.3 | 90.6 | 94.0 |
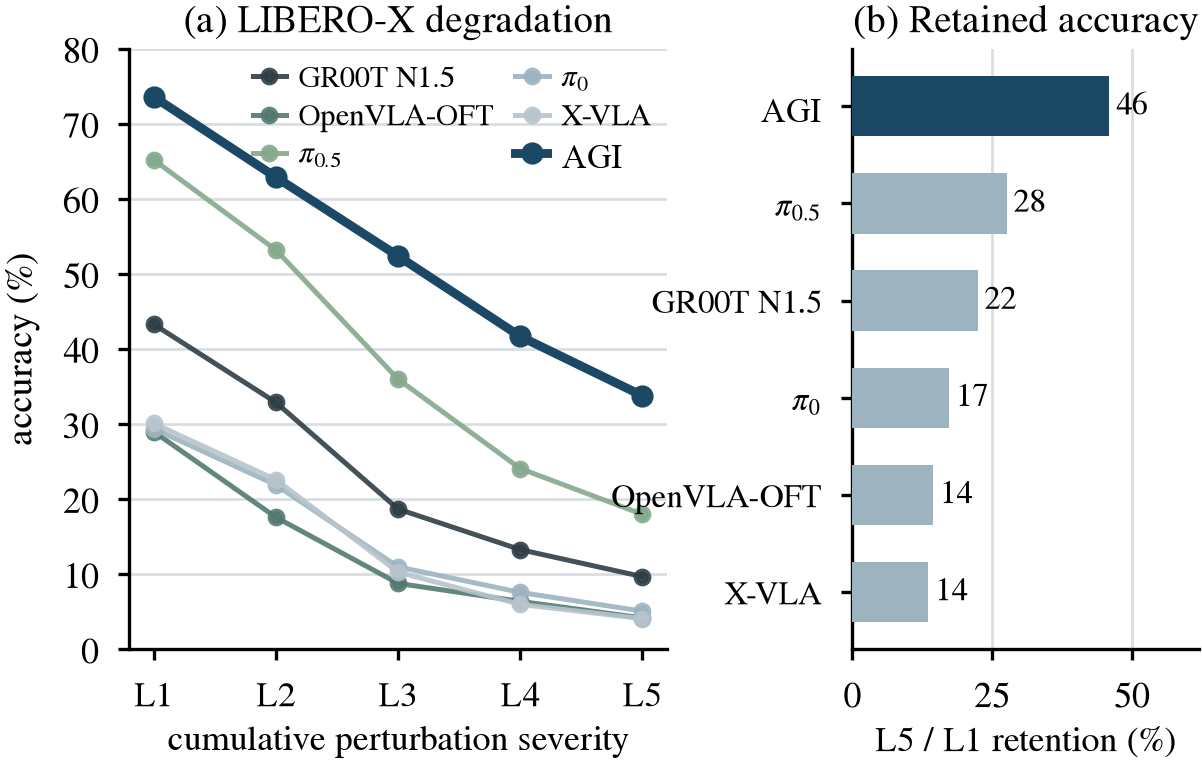
Degradation under cumulative severity
LIBERO-X grades distribution shift across five cumulative severity levels. Our accuracy decreases monotonically from 73.6 at Level 1 to 33.8 at Level 5, remaining above every displayed baseline at each level.
LIBERO-X accuracy (%) under increasing cumulative perturbation severity. L1–L3 use 600 tasks, L4–L5 use 826 tasks. Averaged over levels: ours 52.9, π0.5 39.3, GR00T N1.5 23.6, π0 15.0, X-VLA 14.6, OpenVLA-OFT 13.2.
| Method | Venue | Params | L1 | L2 | L3 | L4 | L5 | Avg. |
|---|---|---|---|---|---|---|---|---|
| GR00T N1.5 | arXiv'25 | 3B | 43.3 | 32.9 | 18.7 | 13.3 | 9.7 | 23.6 |
| OpenVLA-OFT | RSS'25 | 7B | 29.0 | 17.6 | 8.8 | 6.4 | 4.2 | 13.2 |
| π0.5 | CoRL'25 | 3.5B | 65.2 | 53.2 | 36.0 | 24.1 | 18.0 | 39.3 |
| π0 | RSS'25 | 3.3B | 29.4 | 21.9 | 11.0 | 7.6 | 5.1 | 15.0 |
| X-VLA | ICLR'26 | 1B | 30.1 | 22.6 | 10.3 | 6.0 | 4.1 | 14.6 |
| AGI Ours | – | 277M | 73.6 | 62.9 | 52.4 | 41.7 | 33.8 | 52.9 |
Rollouts on both benchmarks
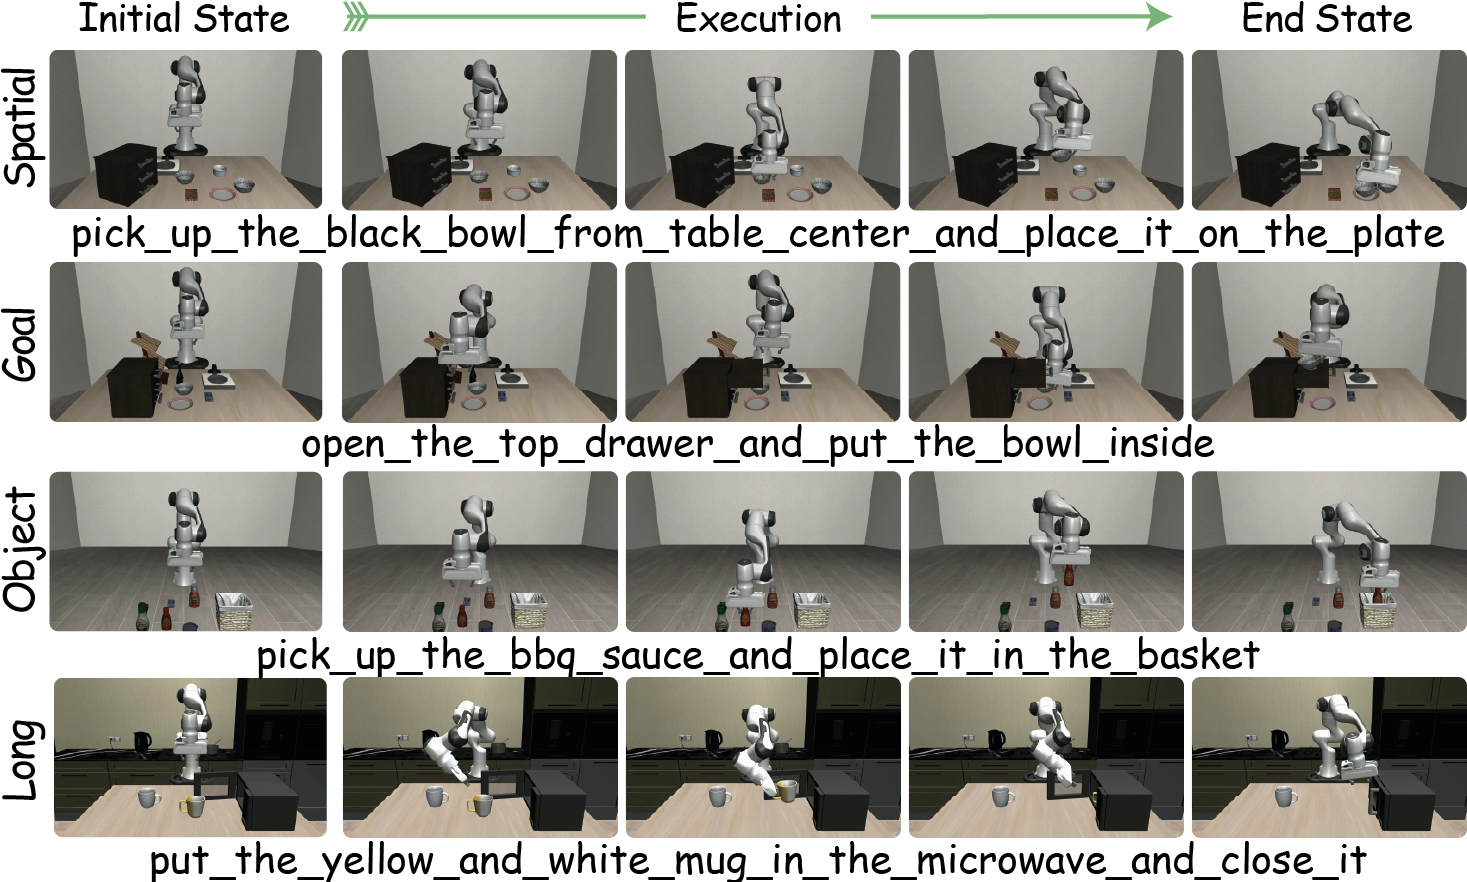
Frames sampled evenly from successful episodes, initial state through execution to the terminal state the success checker accepted. The green outline marks the largest region of each frame that differs from the static scene. The camera never moves, so the median of an episode is the empty scene. It is computed from pixels to trace the arm, and is not an object detection.
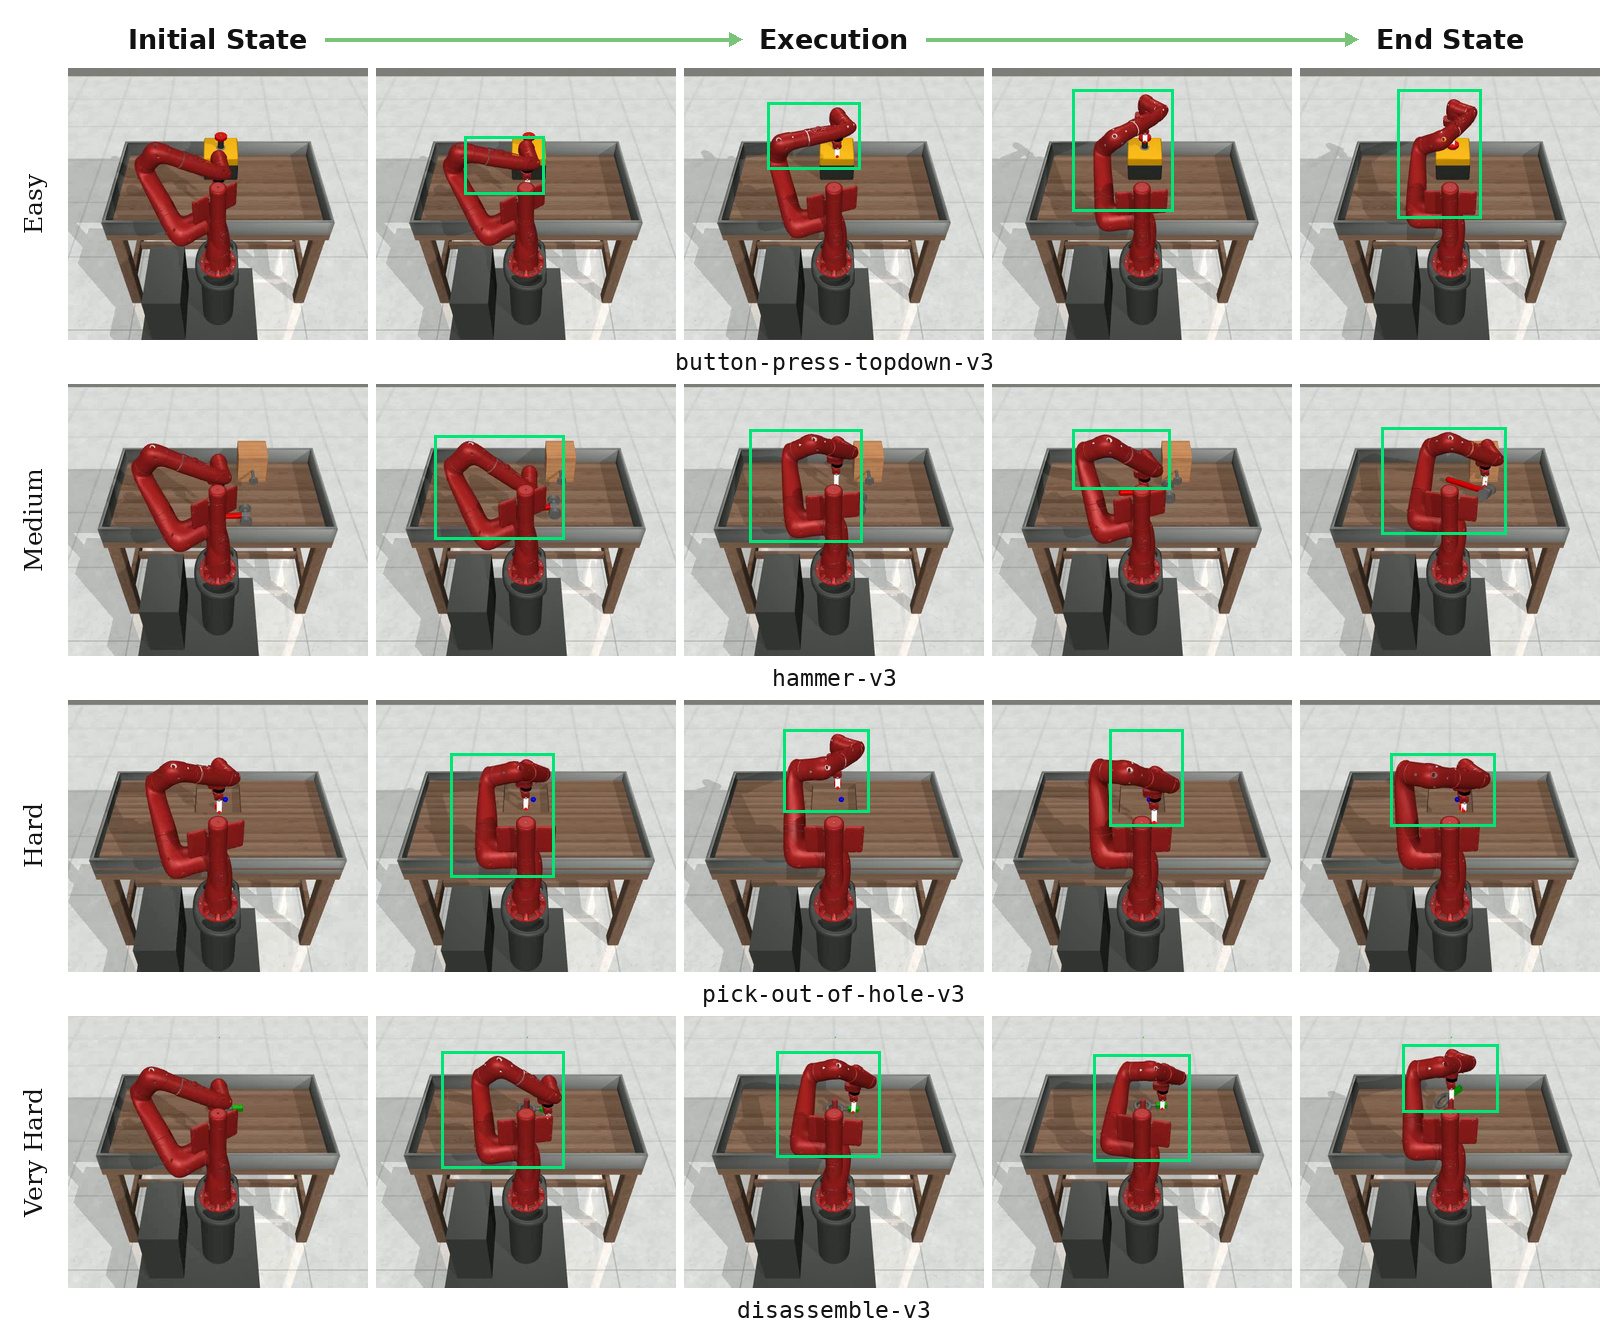
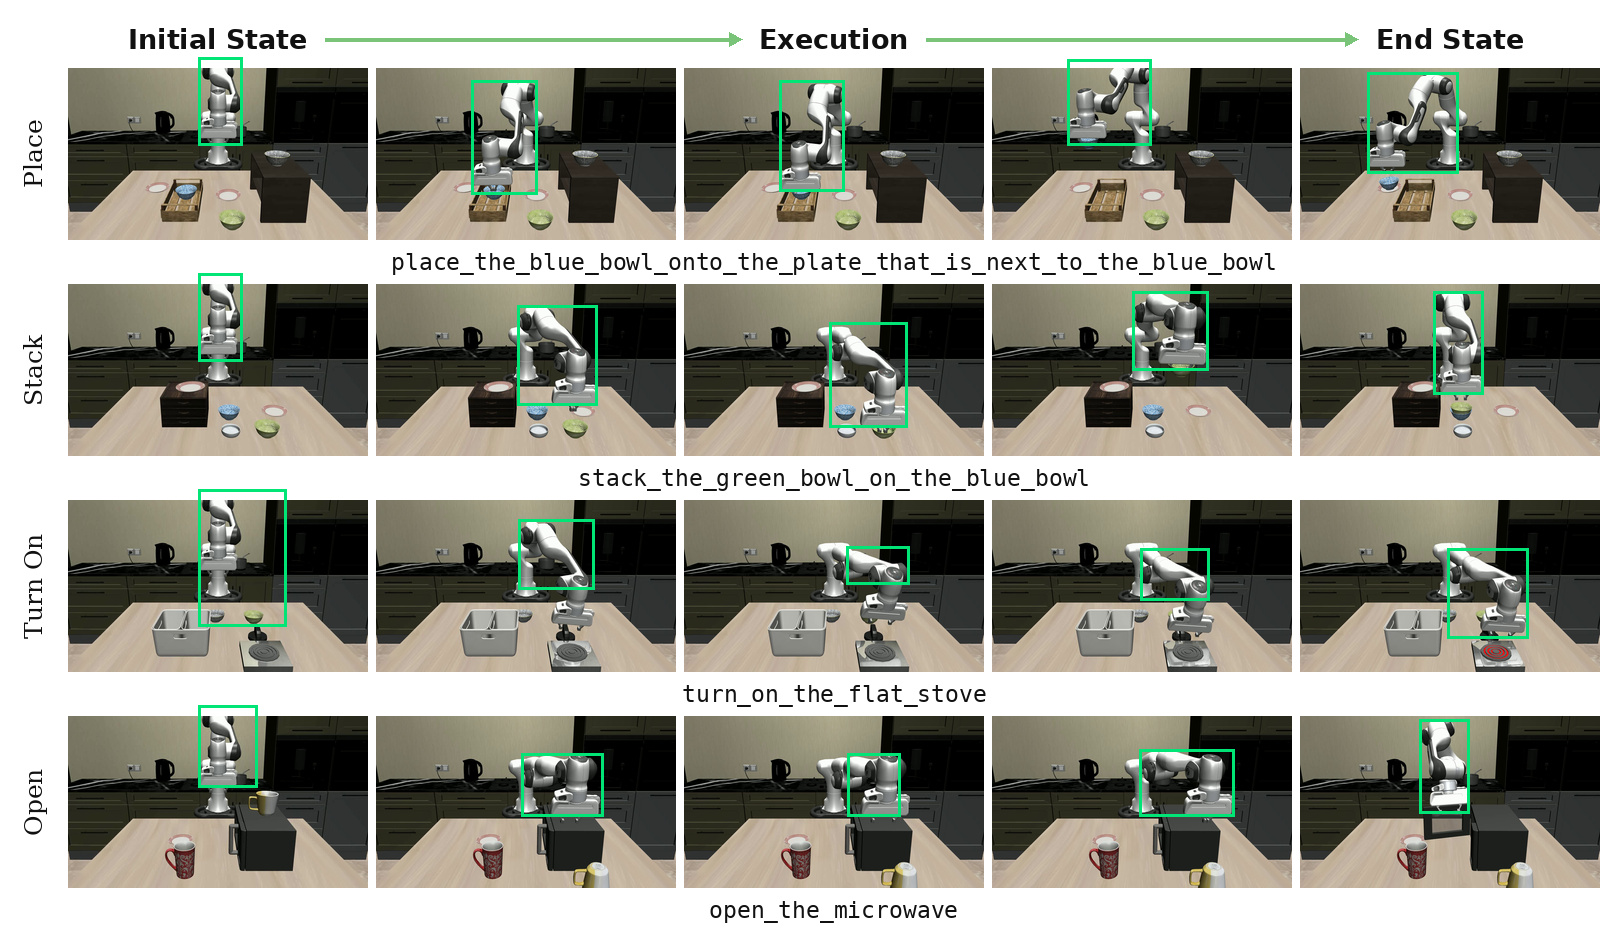
Those four rows are a sample. Every LIBERO-X task that produced a successful episode is browsable frame by frame, with the program statistics recorded for each rollout.
What Each Part Is Worth
Switch the decision rule to separate the program interface from replanning and ranking. Every row received byte-identical ordered candidates, and candidate forks restored the same simulator and RNG state.
Task-aggregated point estimates on LIBERO-PRO Spatial. All K = 3 rows fix the commit length, round budget and step ceiling. At this sample size, differences below roughly 0.10 should be read cautiously; the paired test below is the powered evidence for the ranking claim.
Same-candidate selector diagnostic
Every valid candidate ran to completion from the same restored state, so the only thing that varies is which one the rule picks. M = 800 states, mean 2.88 valid candidates, prevalence 0.52.
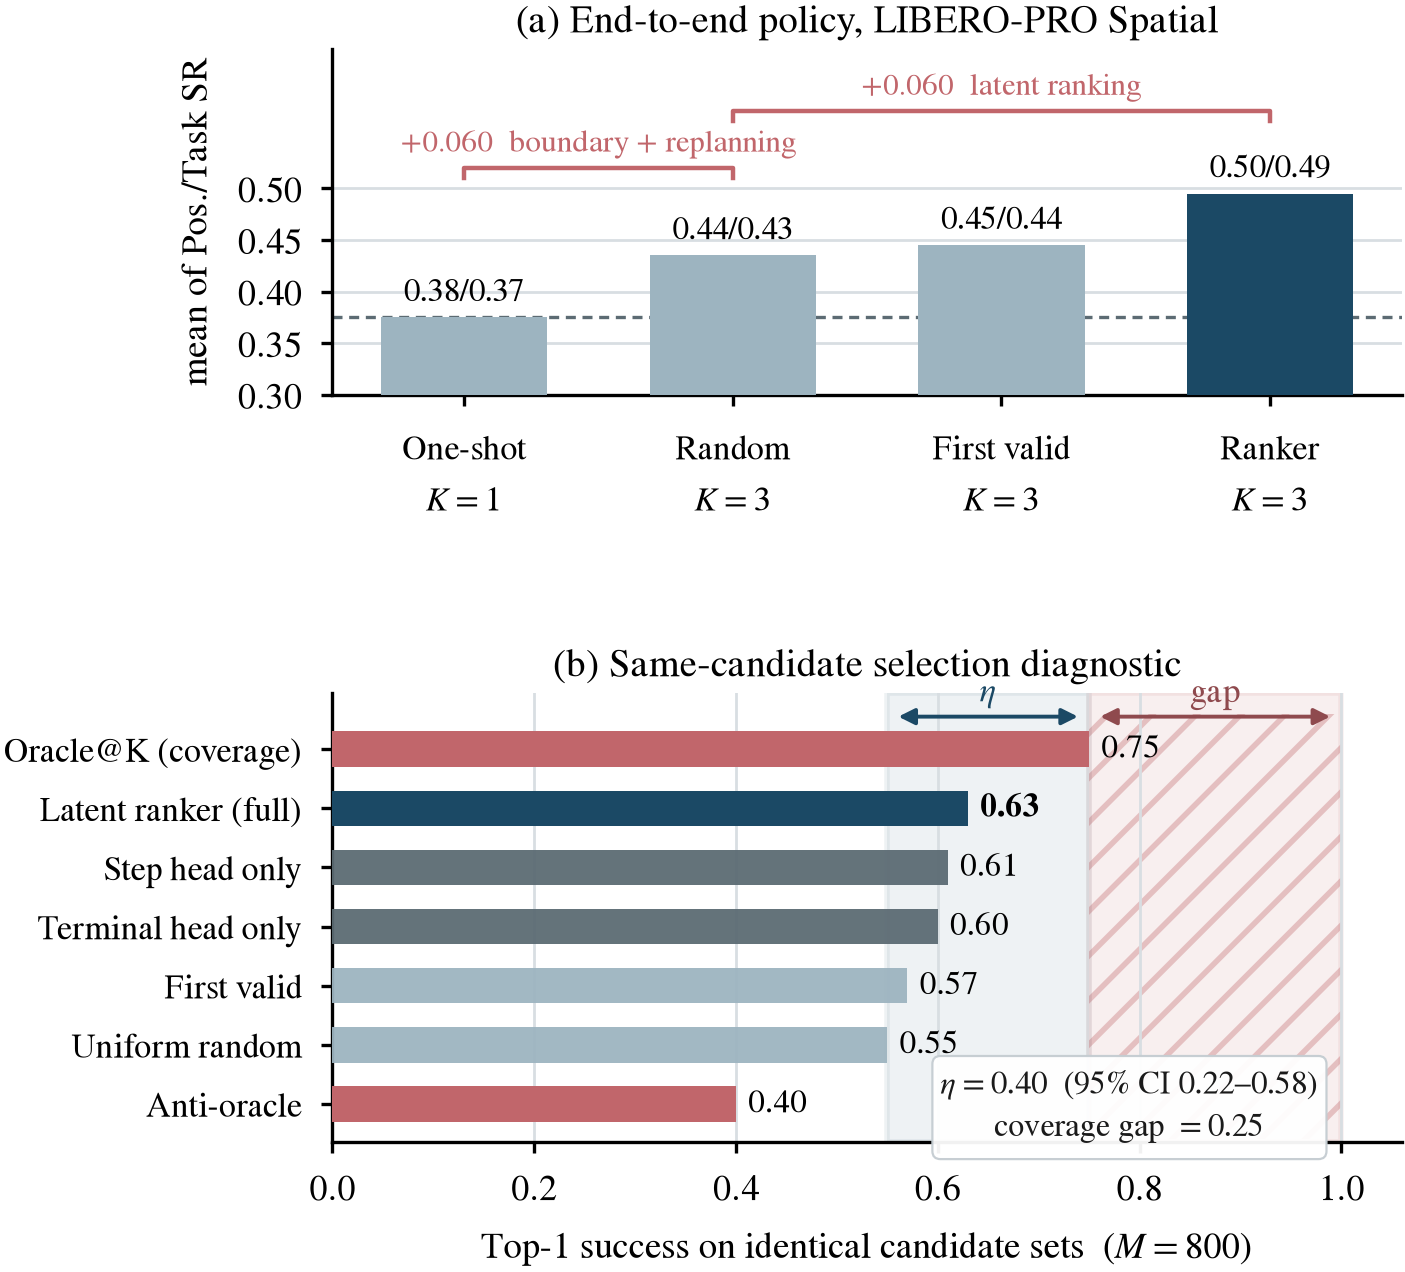
n10 = 112, n01 = 64, exact McNemar p < 0.001
95% CI 0.22–0.58
the larger measured bottleneck
Top-1 success on identical candidate sets. Deterministic rules use paired intervals and McNemar tests against first-valid; exact random uses a paired bootstrap. The 95% interval spans the preregistered modest and principal-effect regions, so we claim a measurable ranking contribution and report its uncertainty rather than treating its magnitude as precisely established.
Component and interface diagnostics
| Variant | Tp/H | Pair-AUC ↑ | NMSE 3/8 ↓ | AUROC enc. ↑ | AUROC imag. ↑ | AP/prev. ↑ | η |
|---|---|---|---|---|---|---|---|
| Full system | 3/8 | 0.70 | 0.35/0.60 | 0.78 | 0.72 | 1.40 | 0.40 |
| No horizon code | 3/8 | = | 0.42/0.80 | = | 0.64 | 1.21 | 0.25 |
| Terminal head only | 3/8 | = | = | 0.75 | 0.68 | 1.26 | 0.25 |
| Step head only | 3/8 | = | = | 0.76 | 0.70 | 1.33 | 0.30 |
| Paired bridge alignment | 3/8 | 0.78 | 0.33/0.57 | = | 0.73 | 1.42 | 0.41 |
| Matched horizon | 8/8 | = | 0.36/0.48 | = | 0.74 | 1.44 | 0.42 |
| Mixed-verifier training | 3/8 | = | = | 0.76 | 0.75 | 1.46 | 0.42 |
“=” marks cells identical to the full system by construction. The three interface corrections are diagnostic improvements: end-to-end Position/Task success was not measured for those rows, so they are not demonstrated policy gains. The no-horizon-code row is a single retraining run, a descriptive architectural diagnostic rather than a seeded causal estimate.
Verification Is Not the Bottleneck
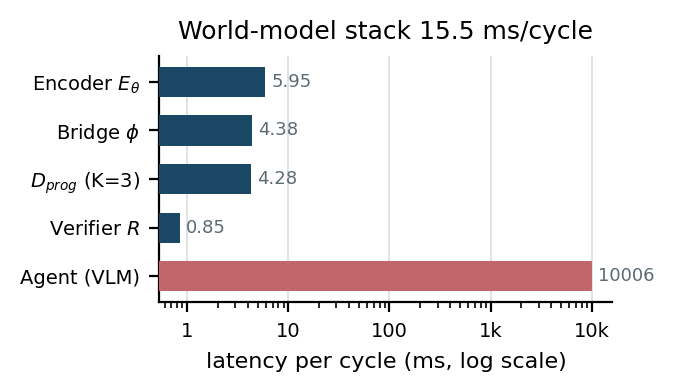
Measured at K = 3, H = 8 on one RTX PRO 6000 in FP16. GPU values are means over 200 cycles after 20 warmups; the proposer round trip is the mean of 60 requests.
| Stage | Mean ms | Rate (Hz) | Share | Params (M) | Peak GB |
|---|---|---|---|---|---|
| Encoder Eθ | 5.95 | – | 0.059% | 93.4 | 0.54† |
| Bridge φ | 4.38 | – | 0.044% | 38.6 | 0.17† |
| Dprog (batched K = 3) | 4.28 | – | 0.043% | 65.9 | 0.40† |
| Verifier R | 0.85 | – | 0.008% | < 1 | < 0.01† |
| Local verification stack | 15.46 | 64.7 | 0.154% | 198.3 | 1.51‡ |
| Proposer (VLM, round trip) | 10 006.00 | 0.100 | 99.846% | remote | remote |
| Decision path (synchronous) | 10 021.46 | 0.100 | 100% | – | 1.51‡ |
| Tracker / env. step§ | 0.52 | – | excluded | n/a | n/a |
†Module-isolated peak; these entries are not additive. ‡Joint peak with all local weights resident and peak activations. §Per low-level environment step, excluded from decision-path arithmetic because commit duration varies. The cached instruction encoder, one-time parsing and preprocessing, and remote proposer parameters and memory are excluded. These are planning-throughput figures rather than motor-control rates.
An Auditable Decision Record
The explicit program boundary leaves artifacts that reactive action generation does not expose directly.
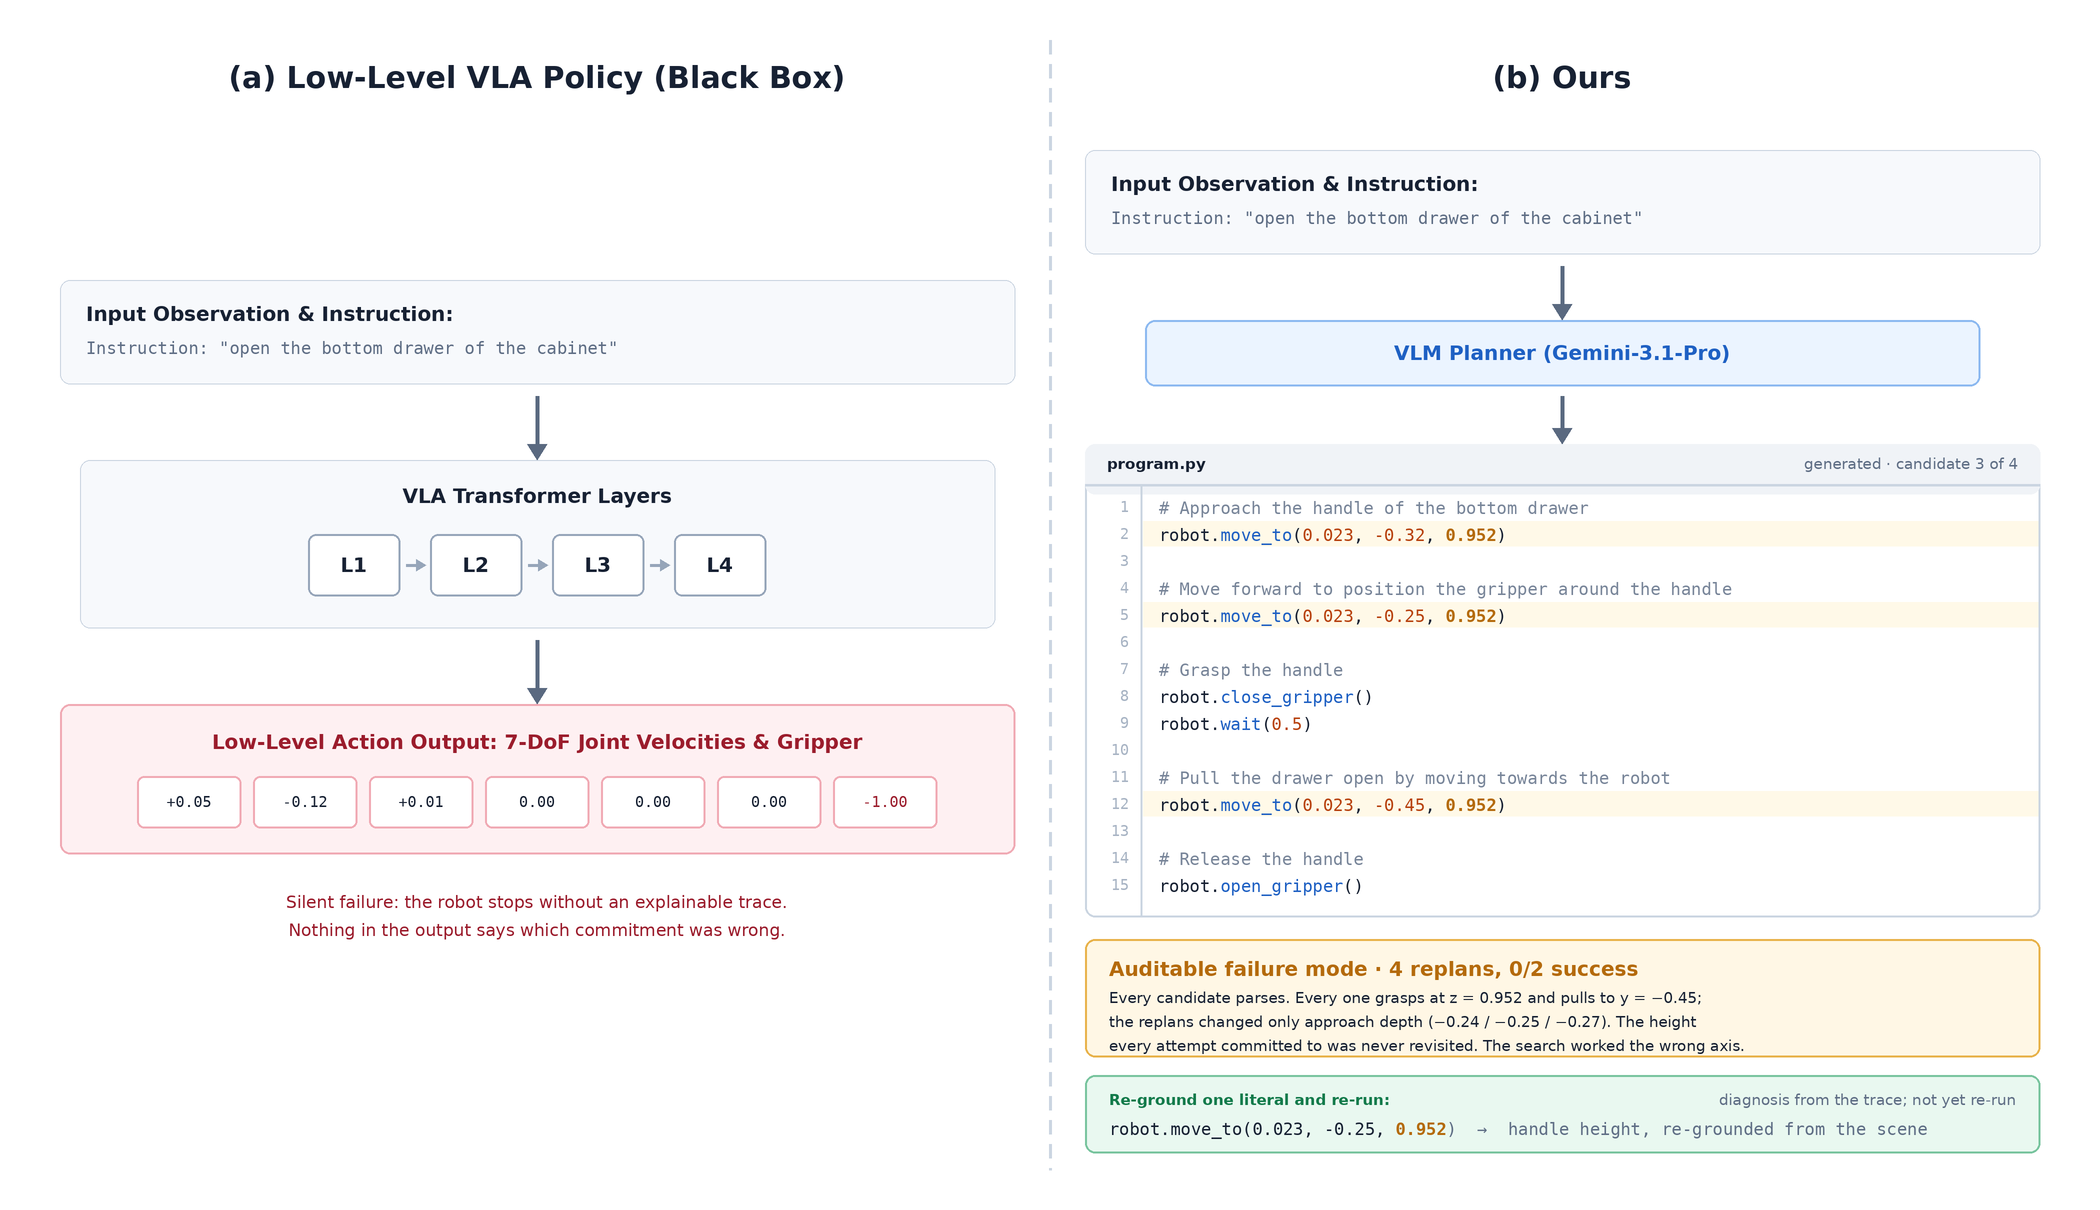
This is a concrete systems property of the interface, not a claim about human interpretability. No user study was run.
Evidence Boundaries
The 0.12 gain is not all ranking
The one-shot-to-full difference combines candidate count, replanning, imagination and ranking. Only the same-candidate fork isolates selection, and it yields +0.06.
Proposal is the larger bottleneck
The remaining oracle and coverage gaps are 0.12 and 0.25. Candidate generation, not ranking, is where the most headroom sits.
Grounding error is not isolated
The proposer writes the robot-base-frame literals and no learned converter modifies them. We do not report a literal-to-ground-truth coordinate-error distribution, so Position-axis claims are made at the interface level.
Robustness is a trade-off
Spatial-Semantic success stays at 0.73, below every displayed baseline. The evidence supports a redistribution of robustness, not uniform superiority.
Train and test interfaces differ
Training supervises three latent steps while planning queries eight, and the dynamics head is trained on an action surrogate but queried on the bridge. The substitution is empirical.
Correction rows are diagnostic only
The interface corrections and the no-horizon-code row lack matched end-to-end reruns or multi-seed intervals.
BibTeX
@inproceedings{anonymous2027agentic,
title     = {AGI: Agentic Intelligence and Latent Lookahead for Robust Manipulation},
author    = {Anonymous},
booktitle = {IEEE International Conference on Robotics and Automation (ICRA)},
year      = {2027},
note      = {Under review}
}
Placeholder entry. Author names are withheld while the paper is under anonymous review.